|
Storms are
on the move !
Stay tuned to weather forecasts,
and check in here for updates.
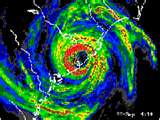
Hurricane MATTHEW
These graphics show probabilities of sustained (1-minute average) surface wind speeds equal to or exceeding 34 kt (39 mph).
These wind speed probability graphics are based on the official National Hurricane Center (NHC) track, intensity, and wind
radii forecasts, and on NHC forecast error statistics for those forecast variables during recent years. Each graphic provides
cumulative probabilities that wind speeds of at least 39 mph will occur during cumulative time periods at each specific point
on the map. The cumulative periods begin at the start of the forecast period and extend through the entire 5-day forecast
period at cumulative 12-hour intervals (i.e., 0-12 h, 0-24 h, 0-36 h, ... , 0-120 h). An individual graphic is produced for
each cumulative interval, and the capability to zoom and animate through the periods is provided. To assess the overall risk
of experiencing winds of at least 39 mph at any location, the 120-h graphics are recommended.
These probabilities will be updated by the NHC with each advisory package for all active tropical cyclones in the Atlantic
and eastern North Pacific basins. While separate graphics are focused on each individual tropical cyclone, probabilities resulting
from more than one active tropical cyclone may be seen on each graphic.
It is important for users to realize that wind speed probabilities that might seem relatively small at their location
might still be quite significant, since they indicate that there is a chance that a damaging or even extreme event could occur
that warrants preparations to protect lives and property.
|